RELEASED

OpenVPN Exporter Prometheus Monitoring

Professional Prometheus exporter for OpenVPN server monitoring with Grafana dashboards, security features, and comprehensive metrics.

openvpn-exporter@monitoring:~$
$ curl -sSL https://raw.githubusercontent.com/B4DCATs/openvpn_exporter/main/quick-start.sh | bash
🚀 Starting OpenVPN Exporter setup...
📊 Metrics available at: http://localhost:9176/metrics
$ docker ps
✅ openvpn-exporter is running!
$ _

Dashboard Preview

Professional monitoring with Grafana

OpenVPN Exporter Grafana Dashboard

Real-time Monitoring

Live OpenVPN server metrics and client statistics

Features

Enterprise-grade monitoring capabilities

📊

Real-time Metrics

Monitor connected clients, traffic statistics, and server health in real-time

🔒

Security Features

IP access control, rate limiting, and secure logging for production environments

📈

Grafana Dashboard

Pre-built professional dashboard with traffic trends and connection analytics

🐳

Docker Ready

One-command deployment with Docker Compose and health checks

Quick Start

Get monitoring up and running in seconds with automated setup scripts

🔧

Multi-Server

Monitor multiple OpenVPN servers from a single exporter instance

Quick Start

Get monitoring up and running in seconds

🚀

One-Command Setup

Automated installation and configuration

curl -sSL https://raw.githubusercontent.com/B4DCATs/openvpn_exporter/main/quick-start.sh | bash
✅ Metrics available at: http://localhost:9176/metrics
🐳

Docker Compose

Manual setup with Docker

curl -O https://raw.githubusercontent.com/B4DCATs/openvpn_exporter/main/docker-compose.yml
docker compose up -d
✅ Container running on port 9176

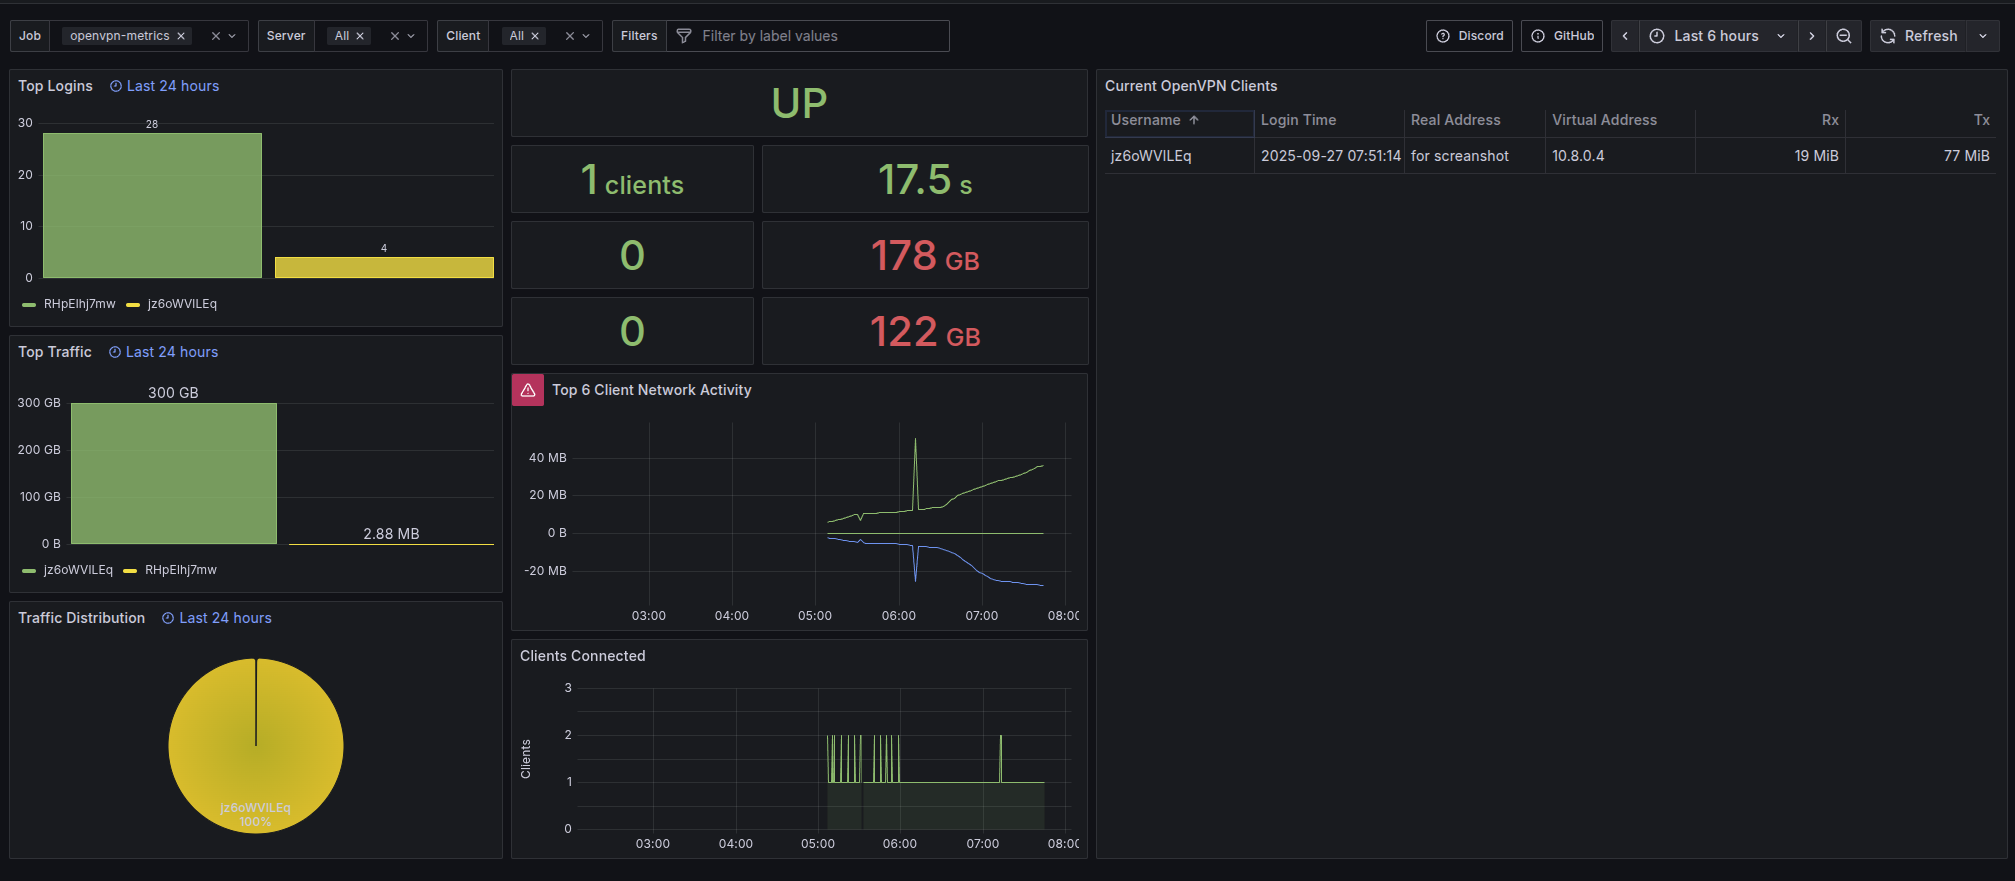
Complete Monitoring Stack

Run Prometheus + Grafana + OpenVPN Exporter together

curl -O https://raw.githubusercontent.com/B4DCATs/openvpn_exporter/main/examples/config/docker-compose.full.yml
docker compose -f docker-compose.full.yml up -d
Prometheus: http://localhost:9090
Grafana: http://localhost:3000
Metrics: http://localhost:9176/metrics

Metrics

Comprehensive OpenVPN server monitoring

Server Metrics

openvpn_up

OpenVPN server status (1=up, 0=down)

openvpn_server_client_count

Number of connected clients

Client Metrics

openvpn_server_client_received_bytes_total

Total bytes received per client

openvpn_server_client_sent_bytes_total

Total bytes sent per client

openvpn_server_client_connection_time

Client connection timestamp

Example PromQL Queries

Total connected clients:
sum(openvpn_server_client_count)
Top 5 clients by traffic:
topk(5, openvpn_server_client_received_bytes_total + openvpn_server_client_sent_bytes_total)
Client connection duration:
time() - openvpn_server_client_connection_time

Security Features

Production-ready security for enterprise environments

🛡️

IP Access Control

Restrict metrics access to specific IP addresses

ALLOWED_IPS="192.168.1.100,10.0.0.50,monitoring-server.local"

Rate Limiting

Protection against abuse and DDoS attacks

🔍

Input Validation

All inputs validated and sanitized

🚫

Path Traversal Protection

Prevents directory traversal attacks

📝

Secure Logging

Structured logging with sensitive data protection

👤

Non-root Container

Runs as non-privileged user in Docker